Performance benchmarking
This section provides information and results from performance benchmarking of gprMax.
How to benchmark?
The following simple models (found in the tests/benchmarking sub-package) can be used to benchmark gprMax on your own system. The models feature different domain sizes (from 100^3 to 450^3 cells) and contain a simple Hertzian dipole source in free space. The following shows an example of the 100^3 cell model:
1#domain: 0.1 0.1 0.1
2#dx_dy_dz: 0.001 0.001 0.001
3#time_window: 3e-9
4
5#waveform: gaussiandotnorm 1 900e6 MySource
6#hertzian_dipole: x 0.05 0.05 0.05 MySource
7#rx: 0.05 0.05 0.05
Using the following steps to collect and report benchmarking results for each of the models:
Run gprMax in benchmarking mode, e.g.
python -m gprMax tests/benchmarking/bench_100x100x100.in -benchmarkUse the
plot_benchmarkmodule to create plots of the execution time and speed-up, e.g.python -m tests.benchmarking.plot_benchmark tests/benchmarking/bench_100x100x100.npz. You can combine results into a single plot, e.g. e.g.python -m tests.benchmarking.plot_benchmark tests/benchmarking/bench_100x100x100.npz --otherresults tests/benchmarking/bench_150x150x150.npz.Share your data by emailing us your Numpy archives and plot files to info@gprmax.com
Results: CPU
Mac OS X
iMac15,1
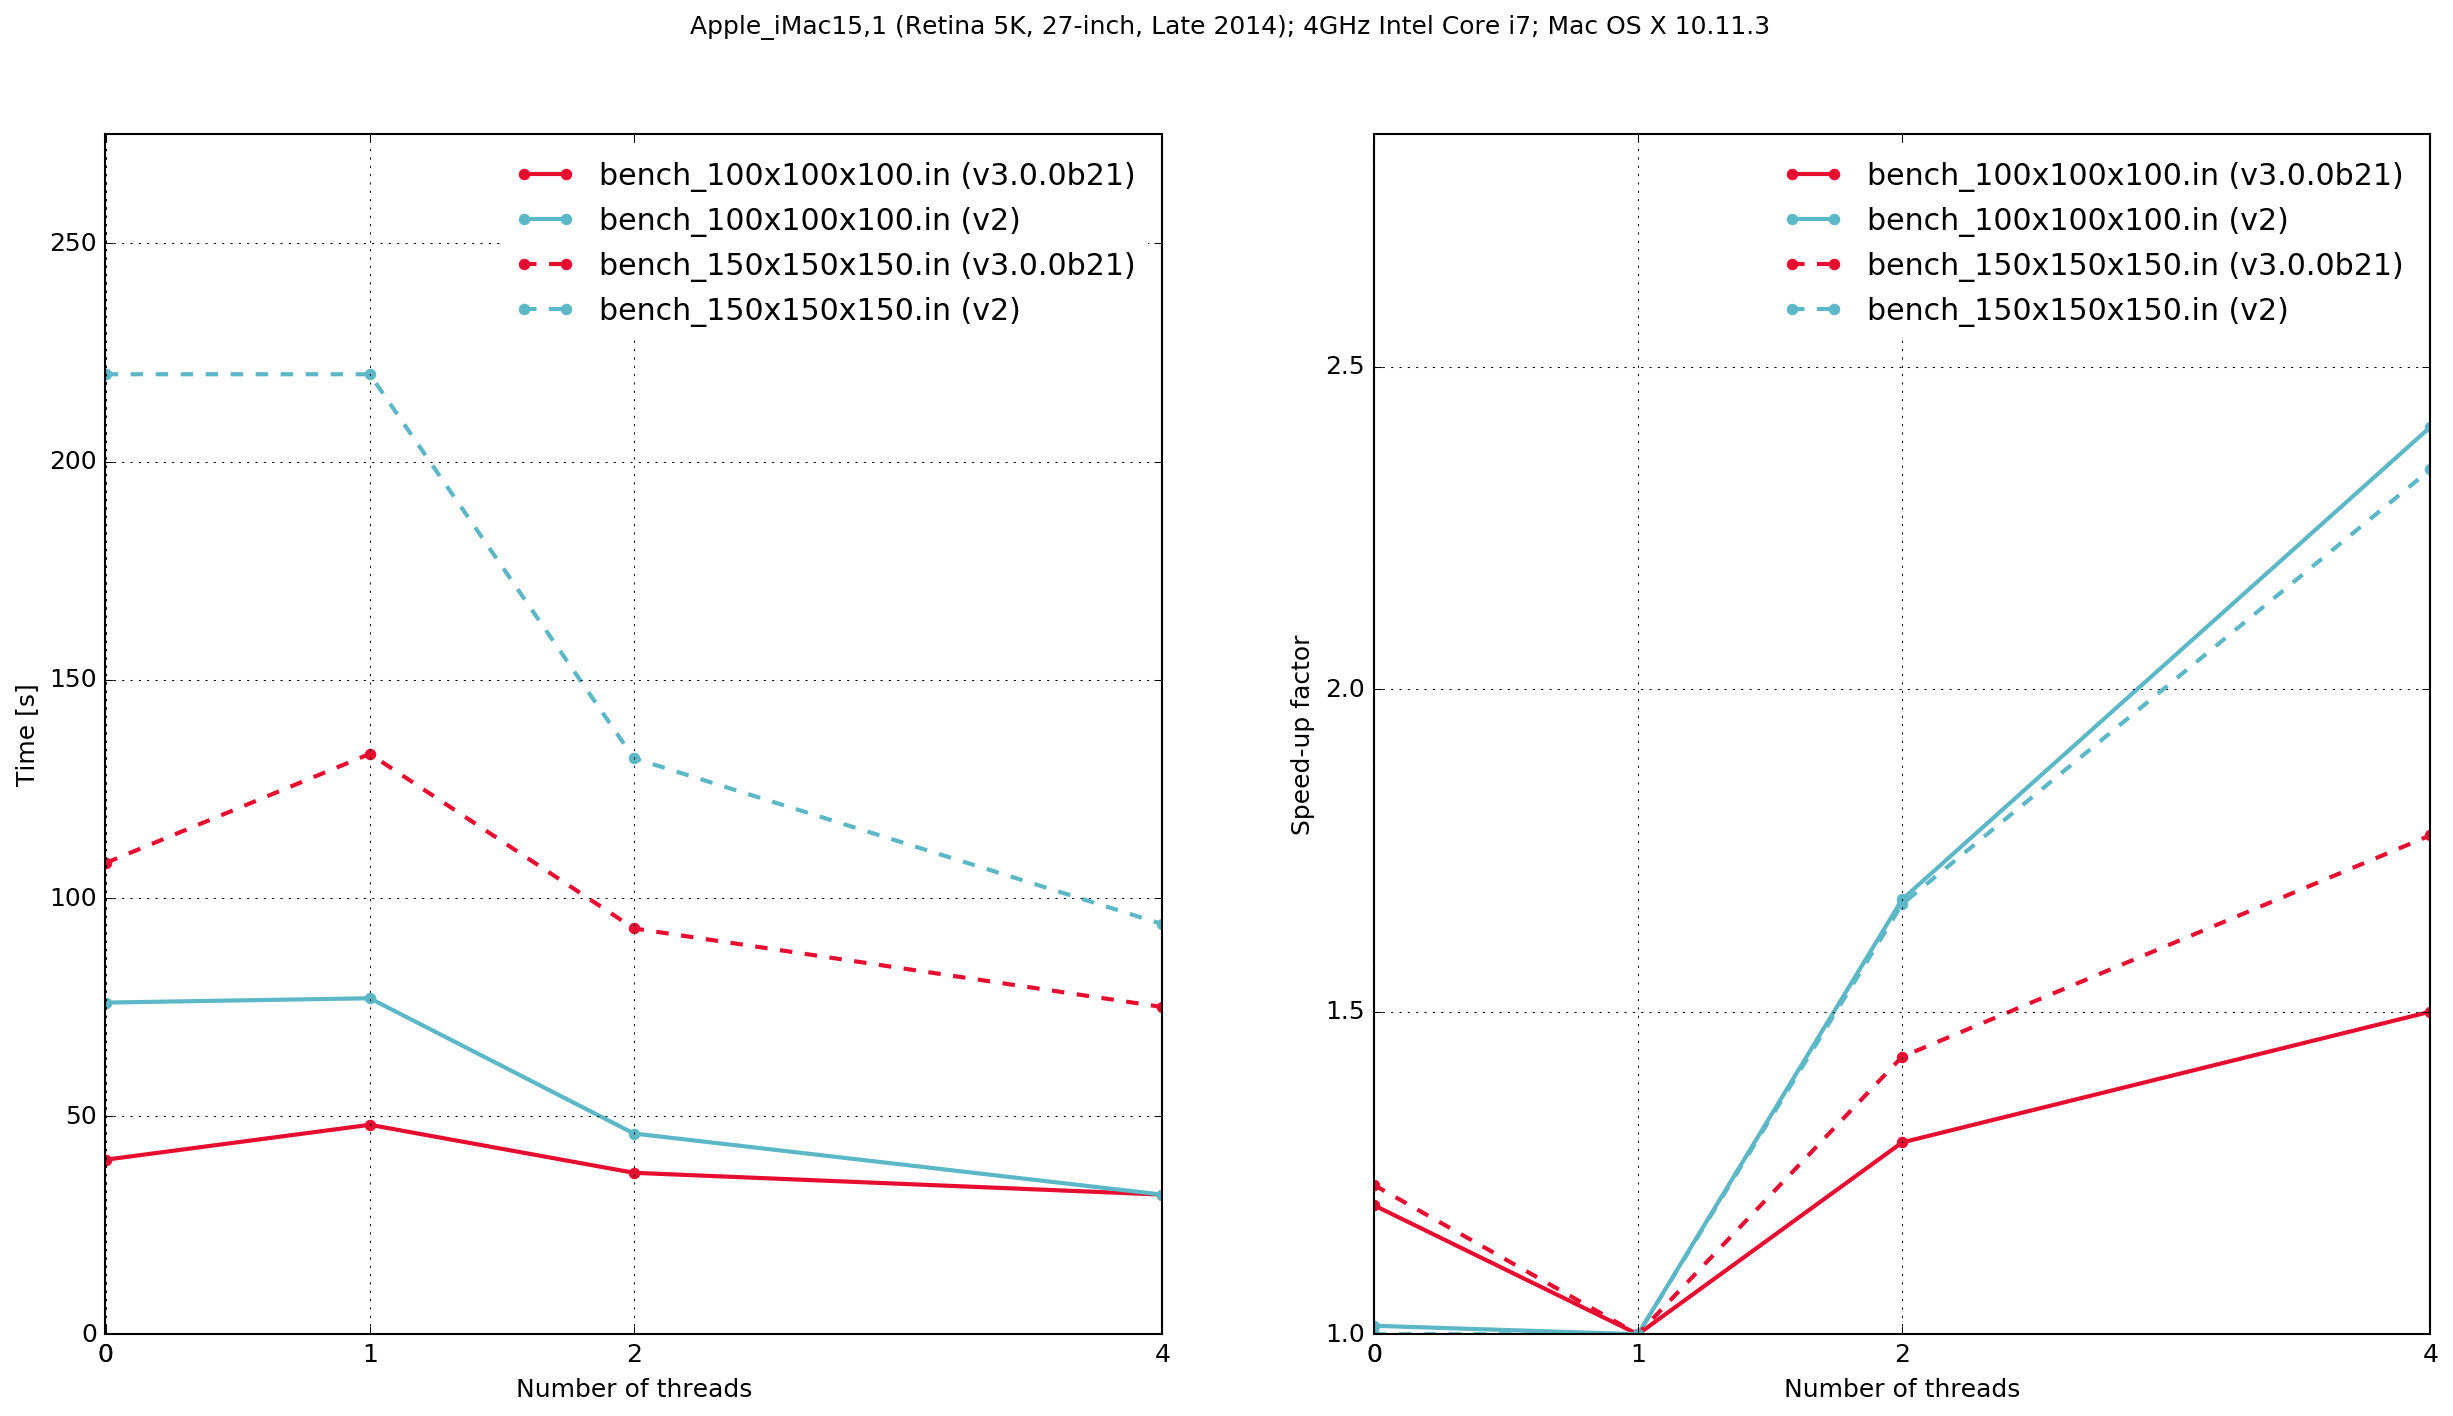
Fig. 49 Execution time and speed-up factor plots for Python/Cython-based gprMax and previous (v.2) C-based code.
Note
Zero threads indicates that the code was compiled serially, i.e. without using OpenMP.
The results demonstrate that the Python/Cython-based code is faster, in these two benchmarks, than the previous version which was written in C. It also shows that the performance scaling with multiple OpenMP threads is better with the C-based code. Results from the C-based code show that when it is compiled serially the performance is approximately the same as when it is compiled with OpenMP and run with a single thread. With the Python/Cython-based code this is not the case. The overhead in setting up and tearing down the OpenMP threads means that for a single thread the performance is worse than the serially-compiled version.
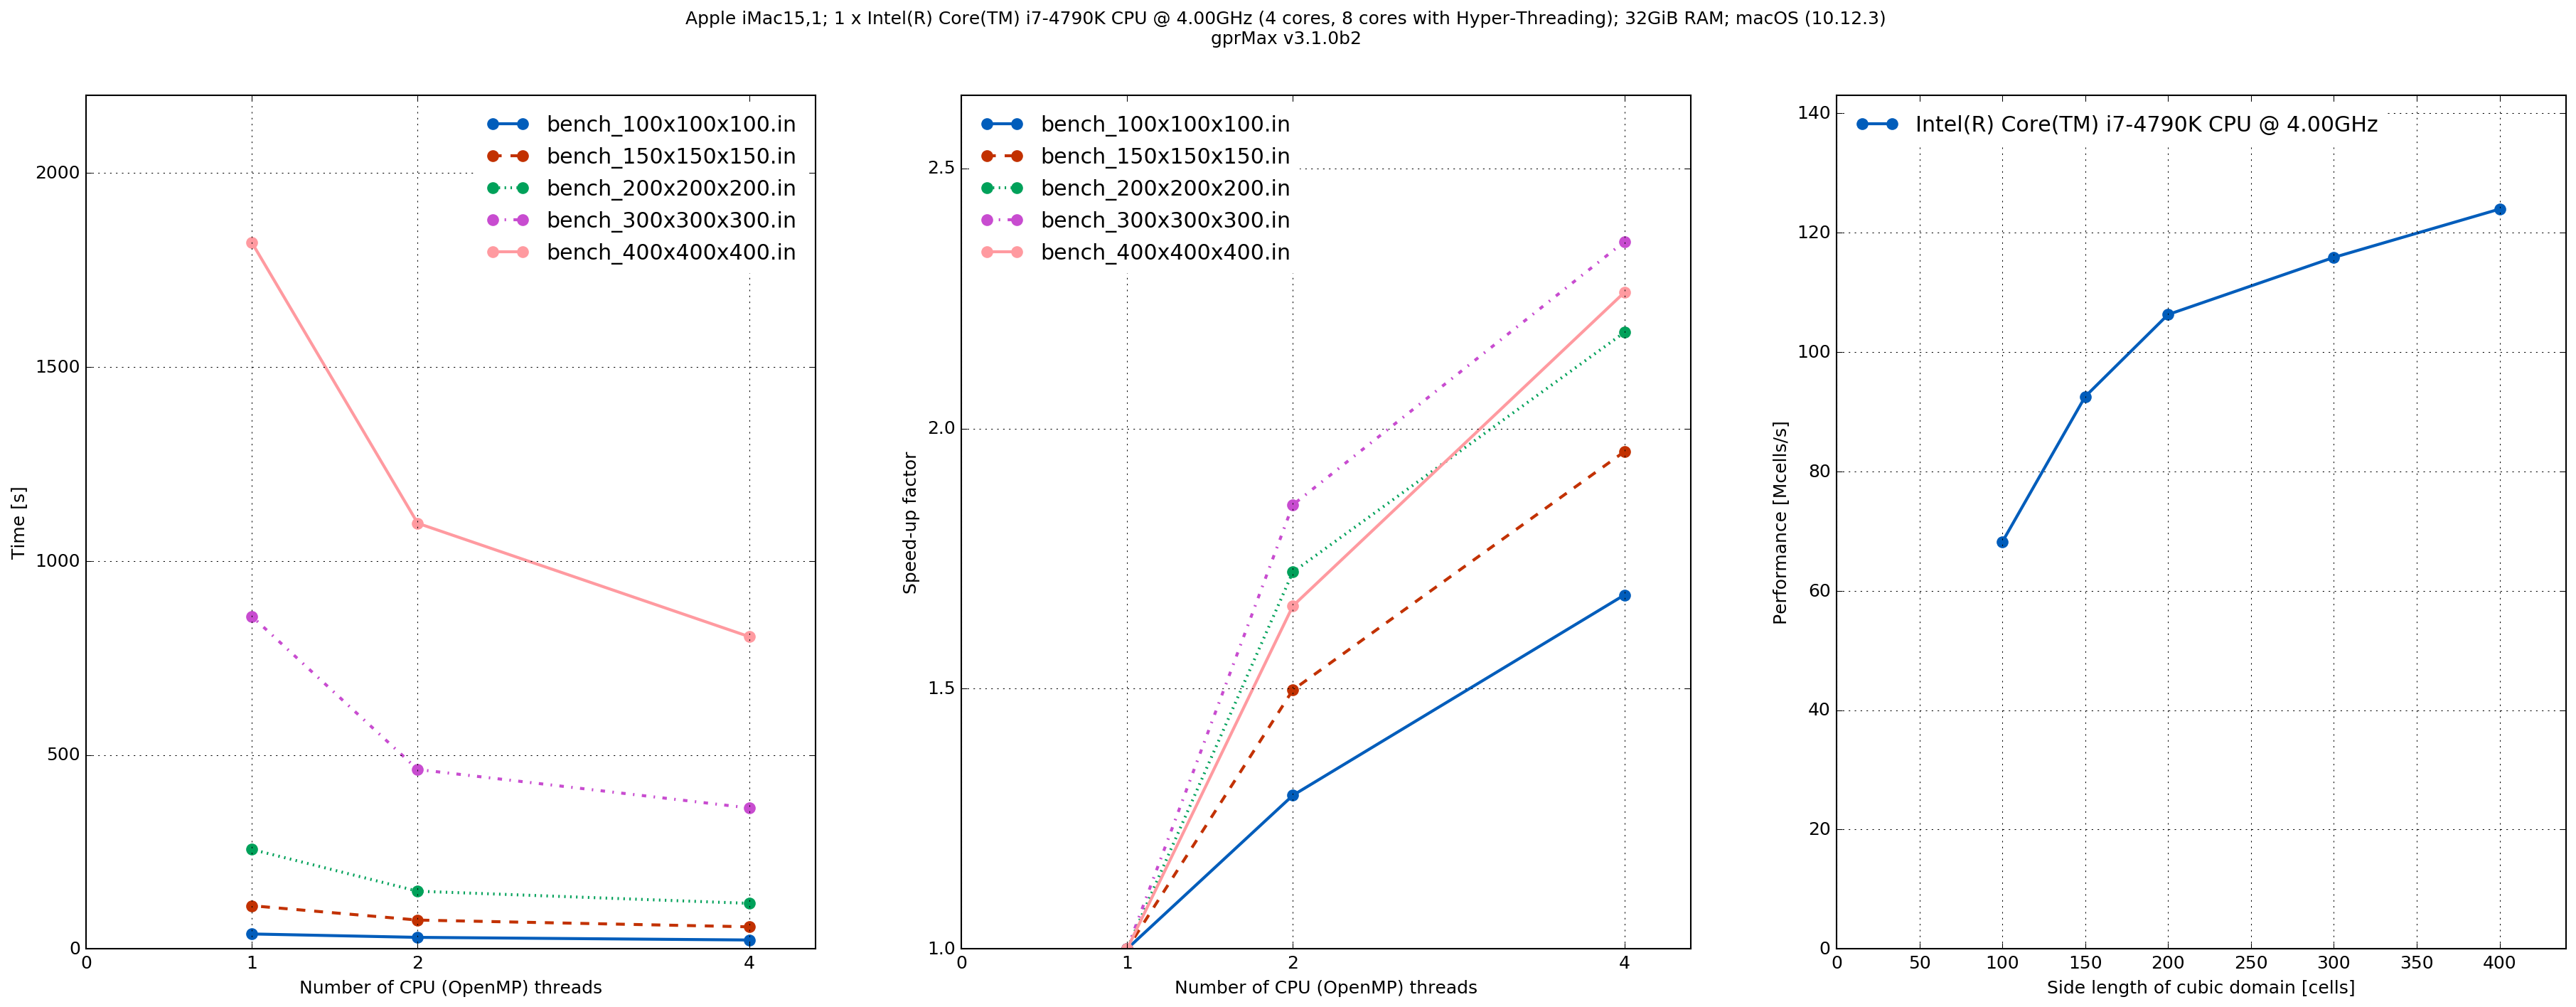
iMac15,1
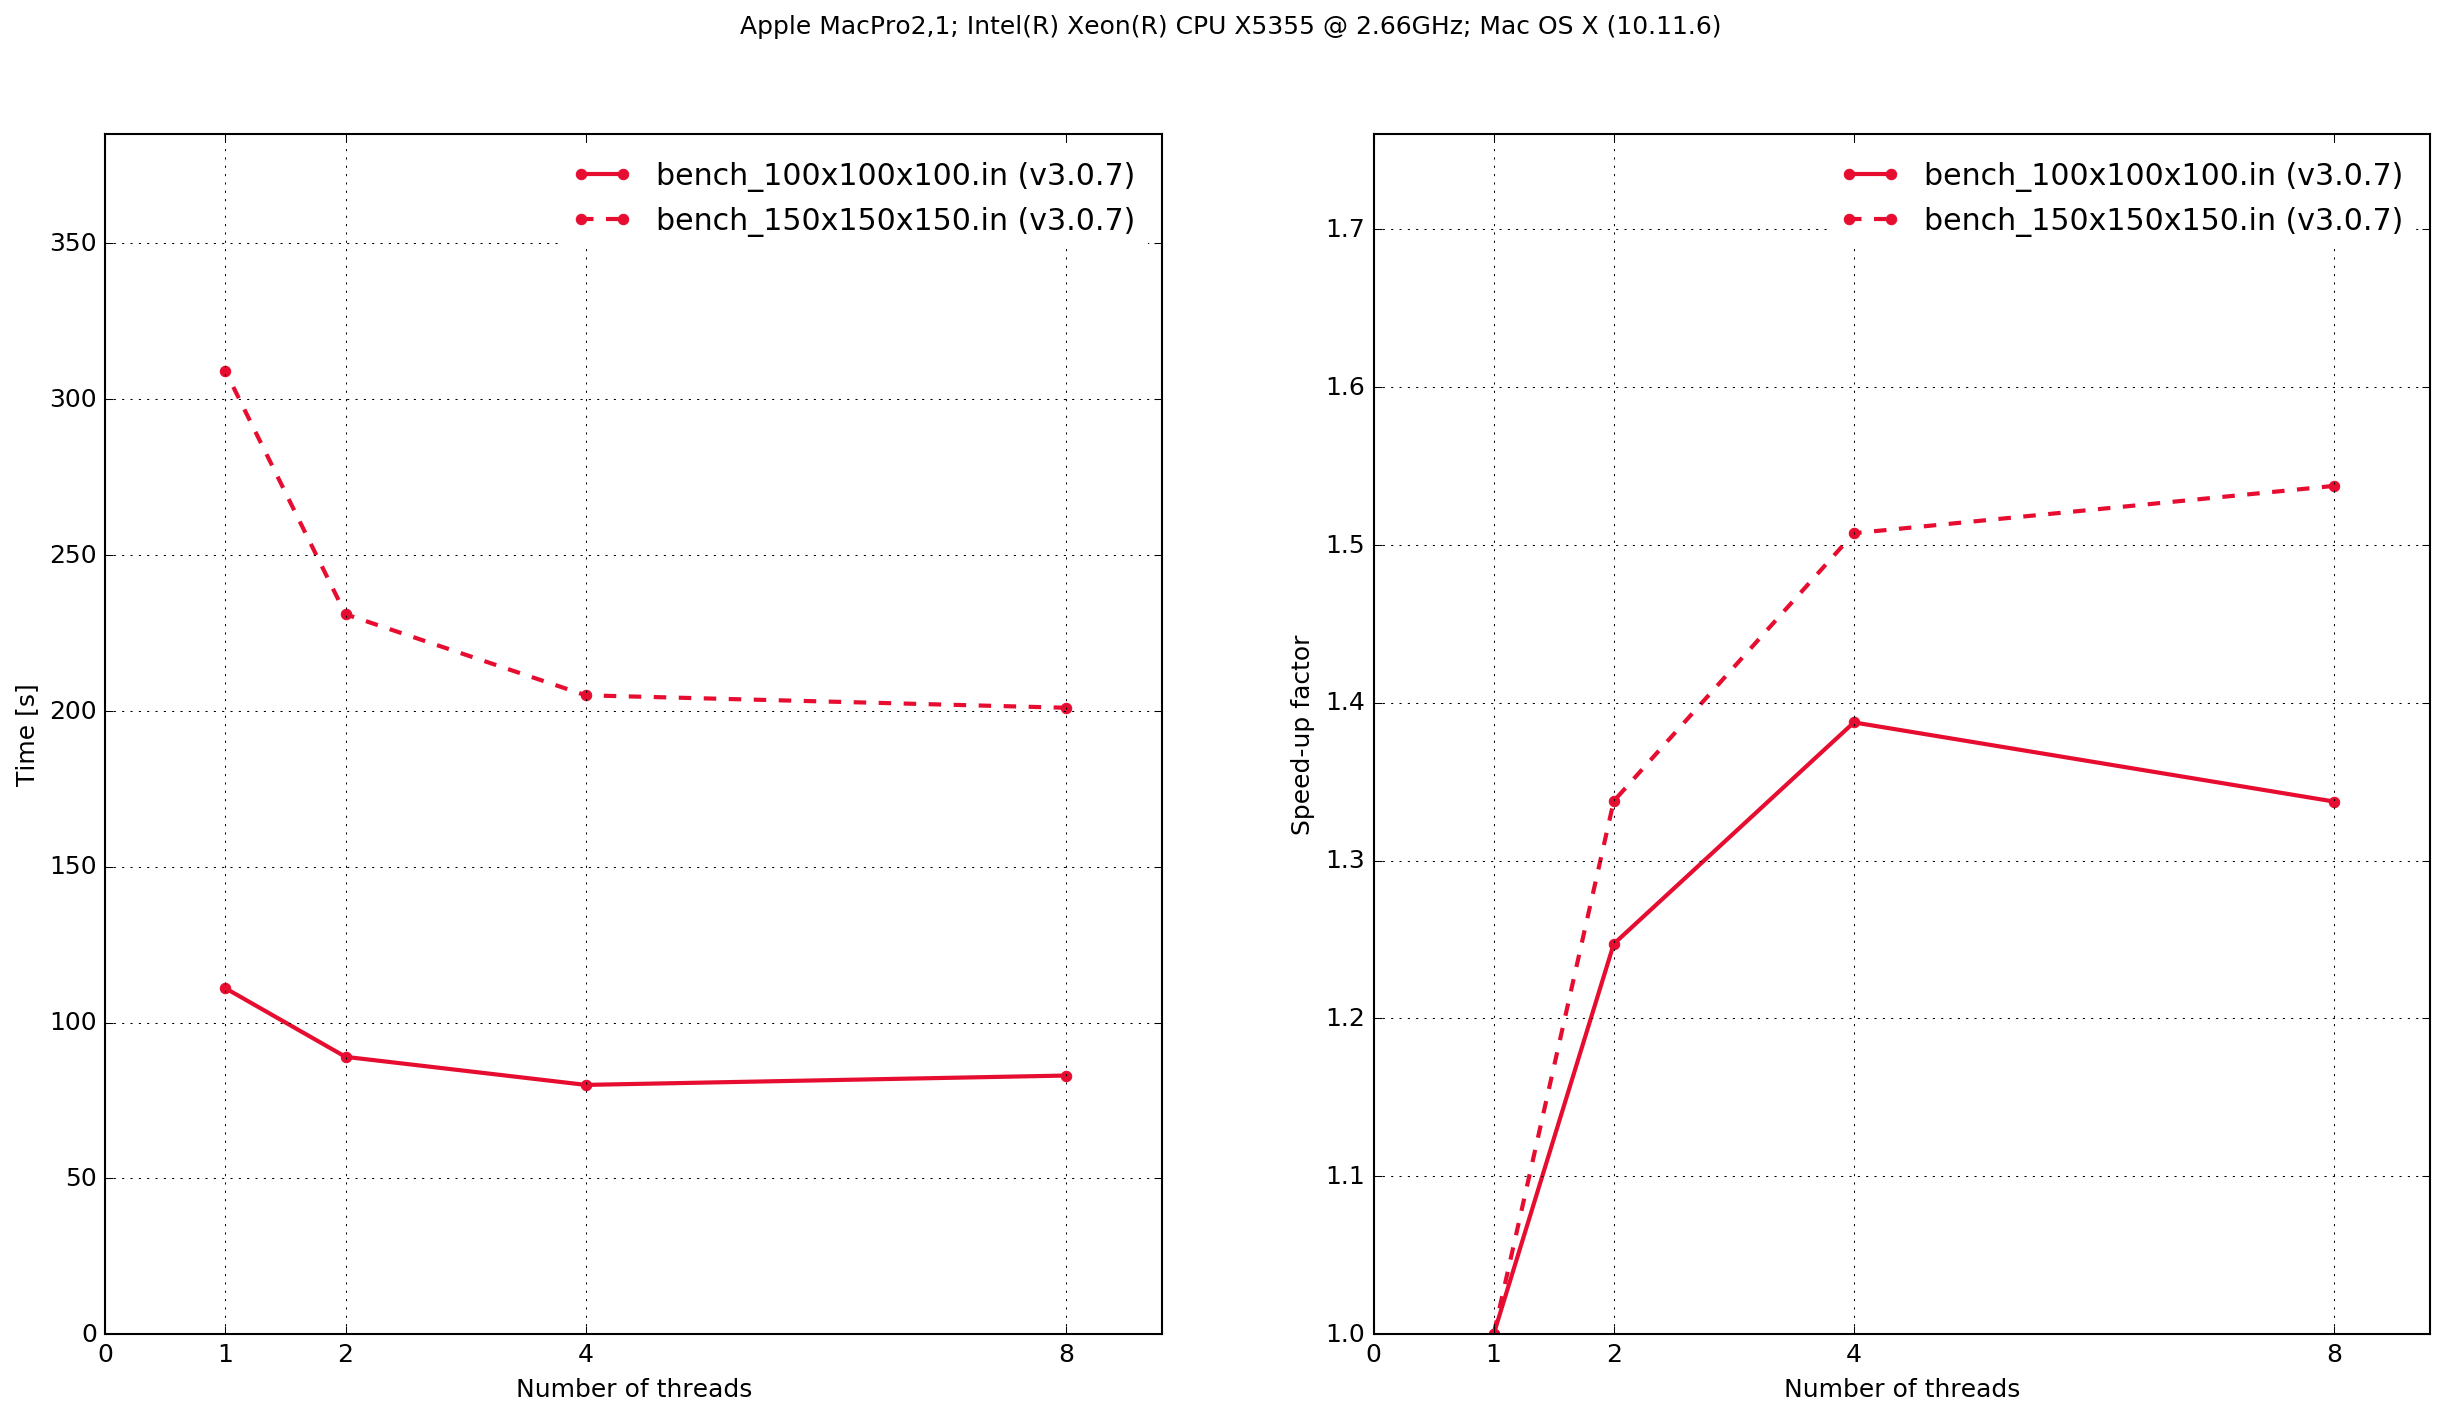
MacPro1,1
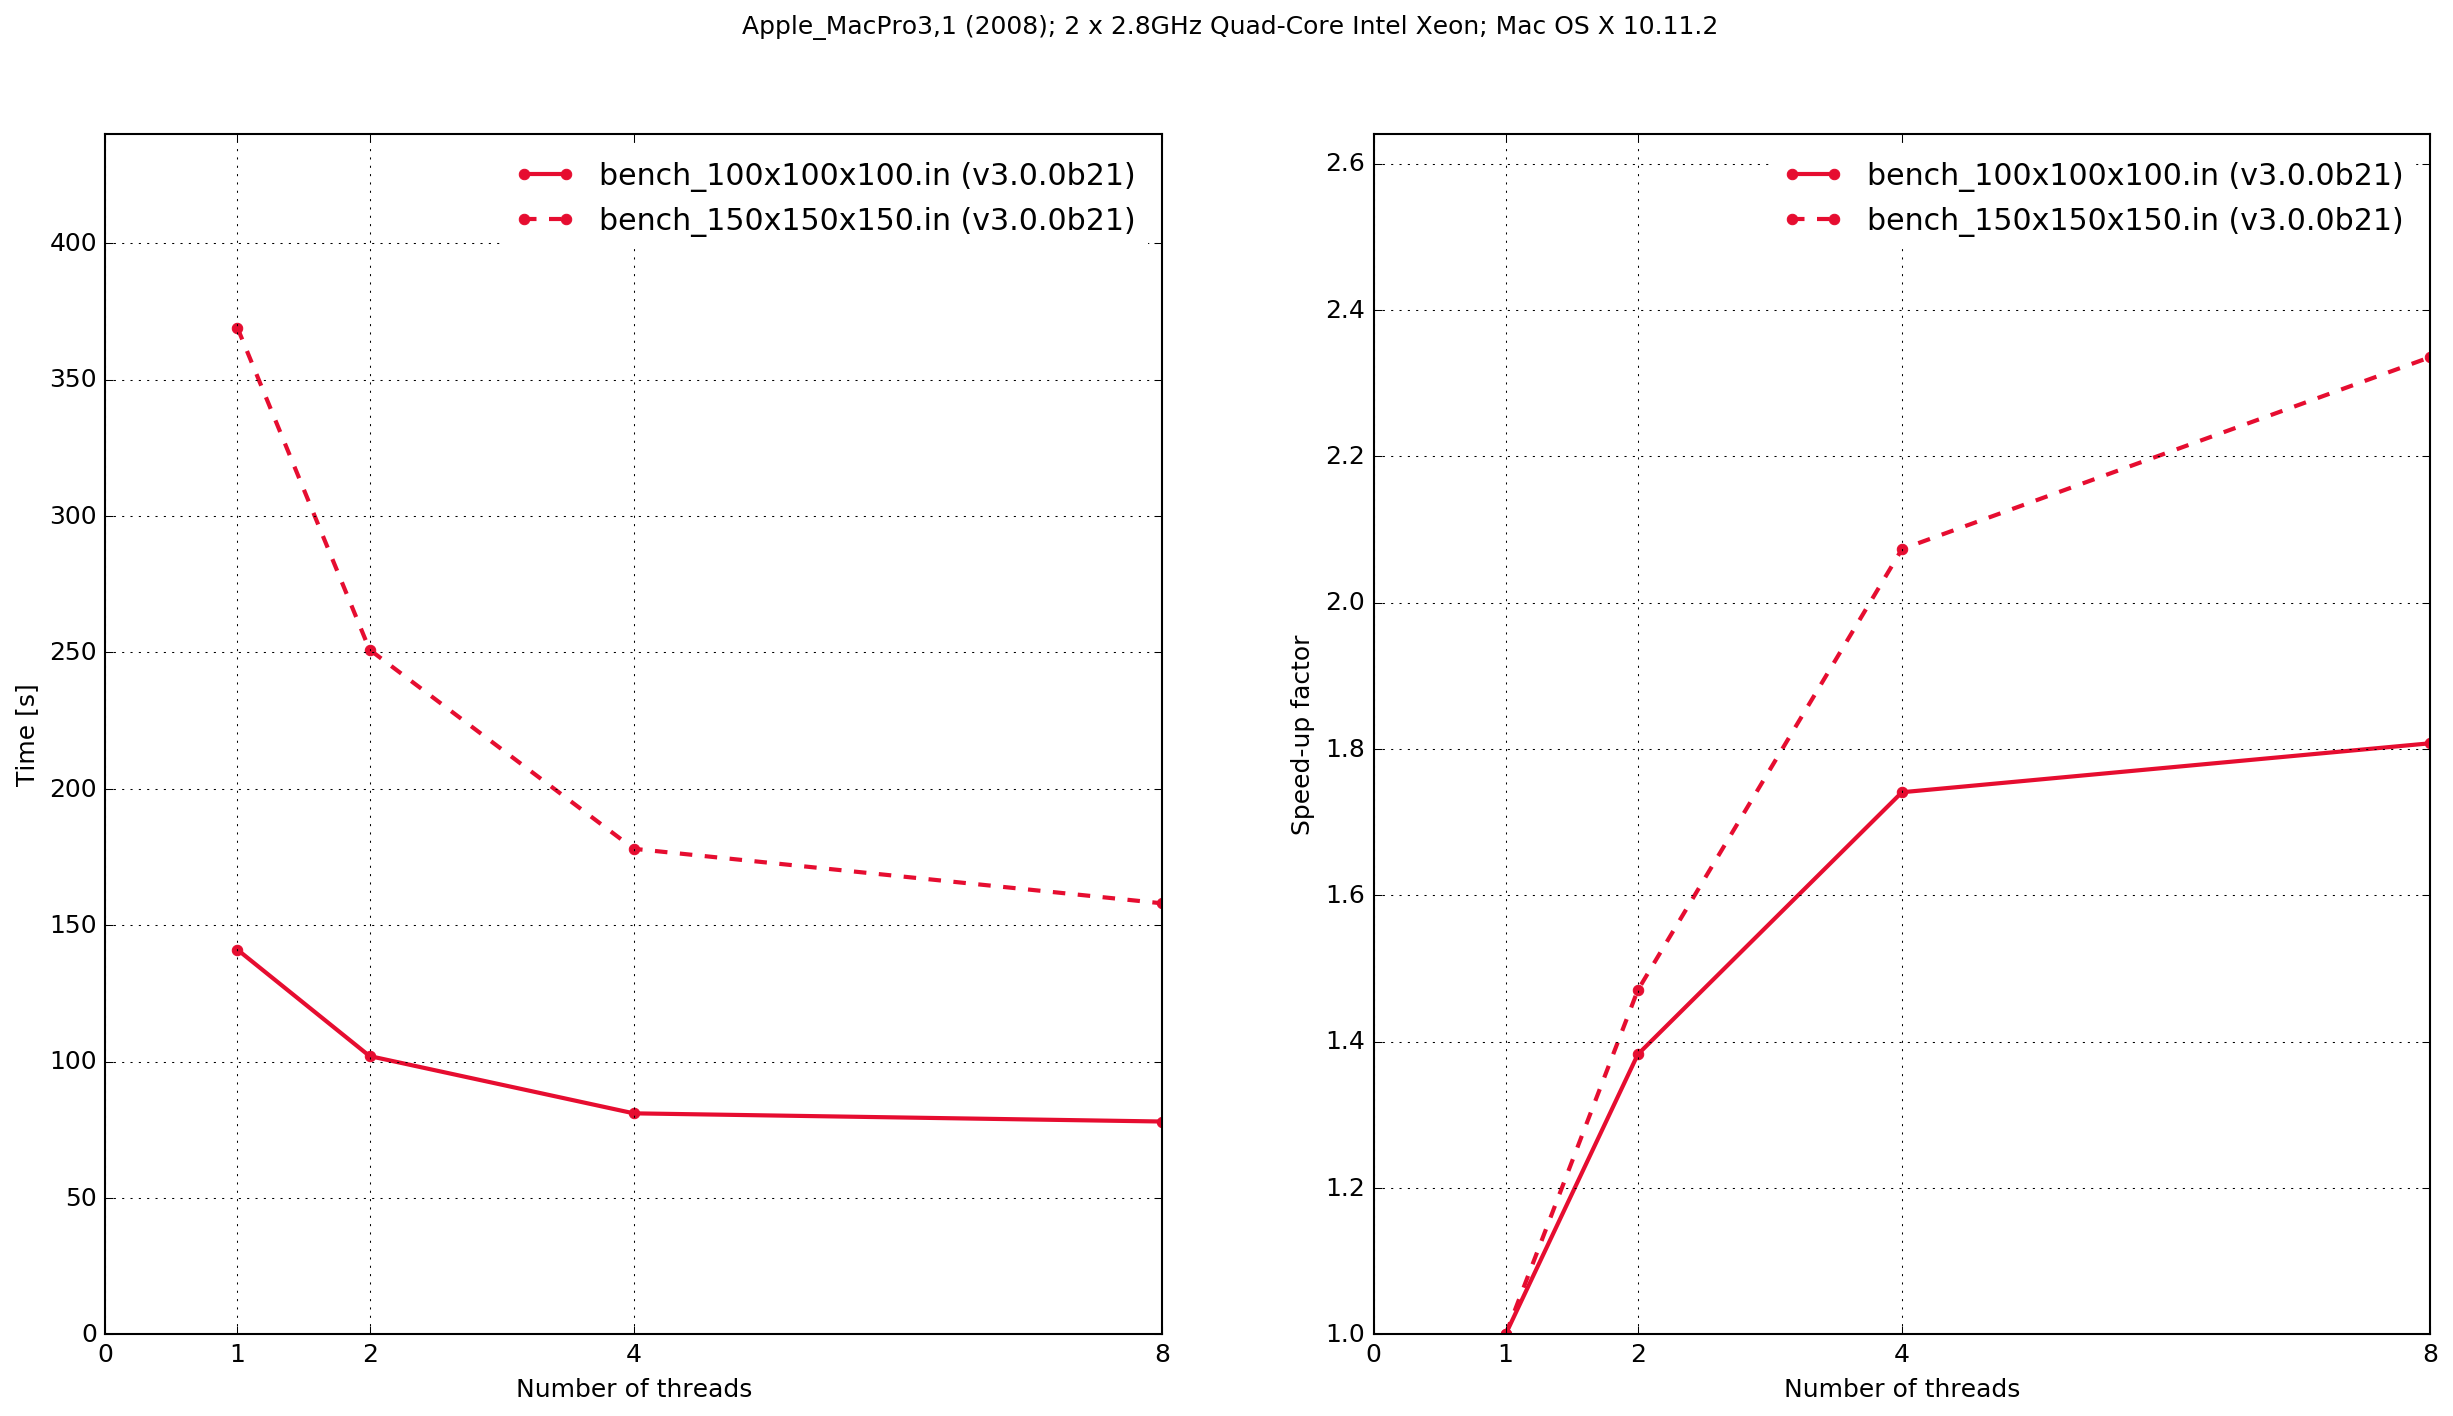
MacPro3,1
Linux
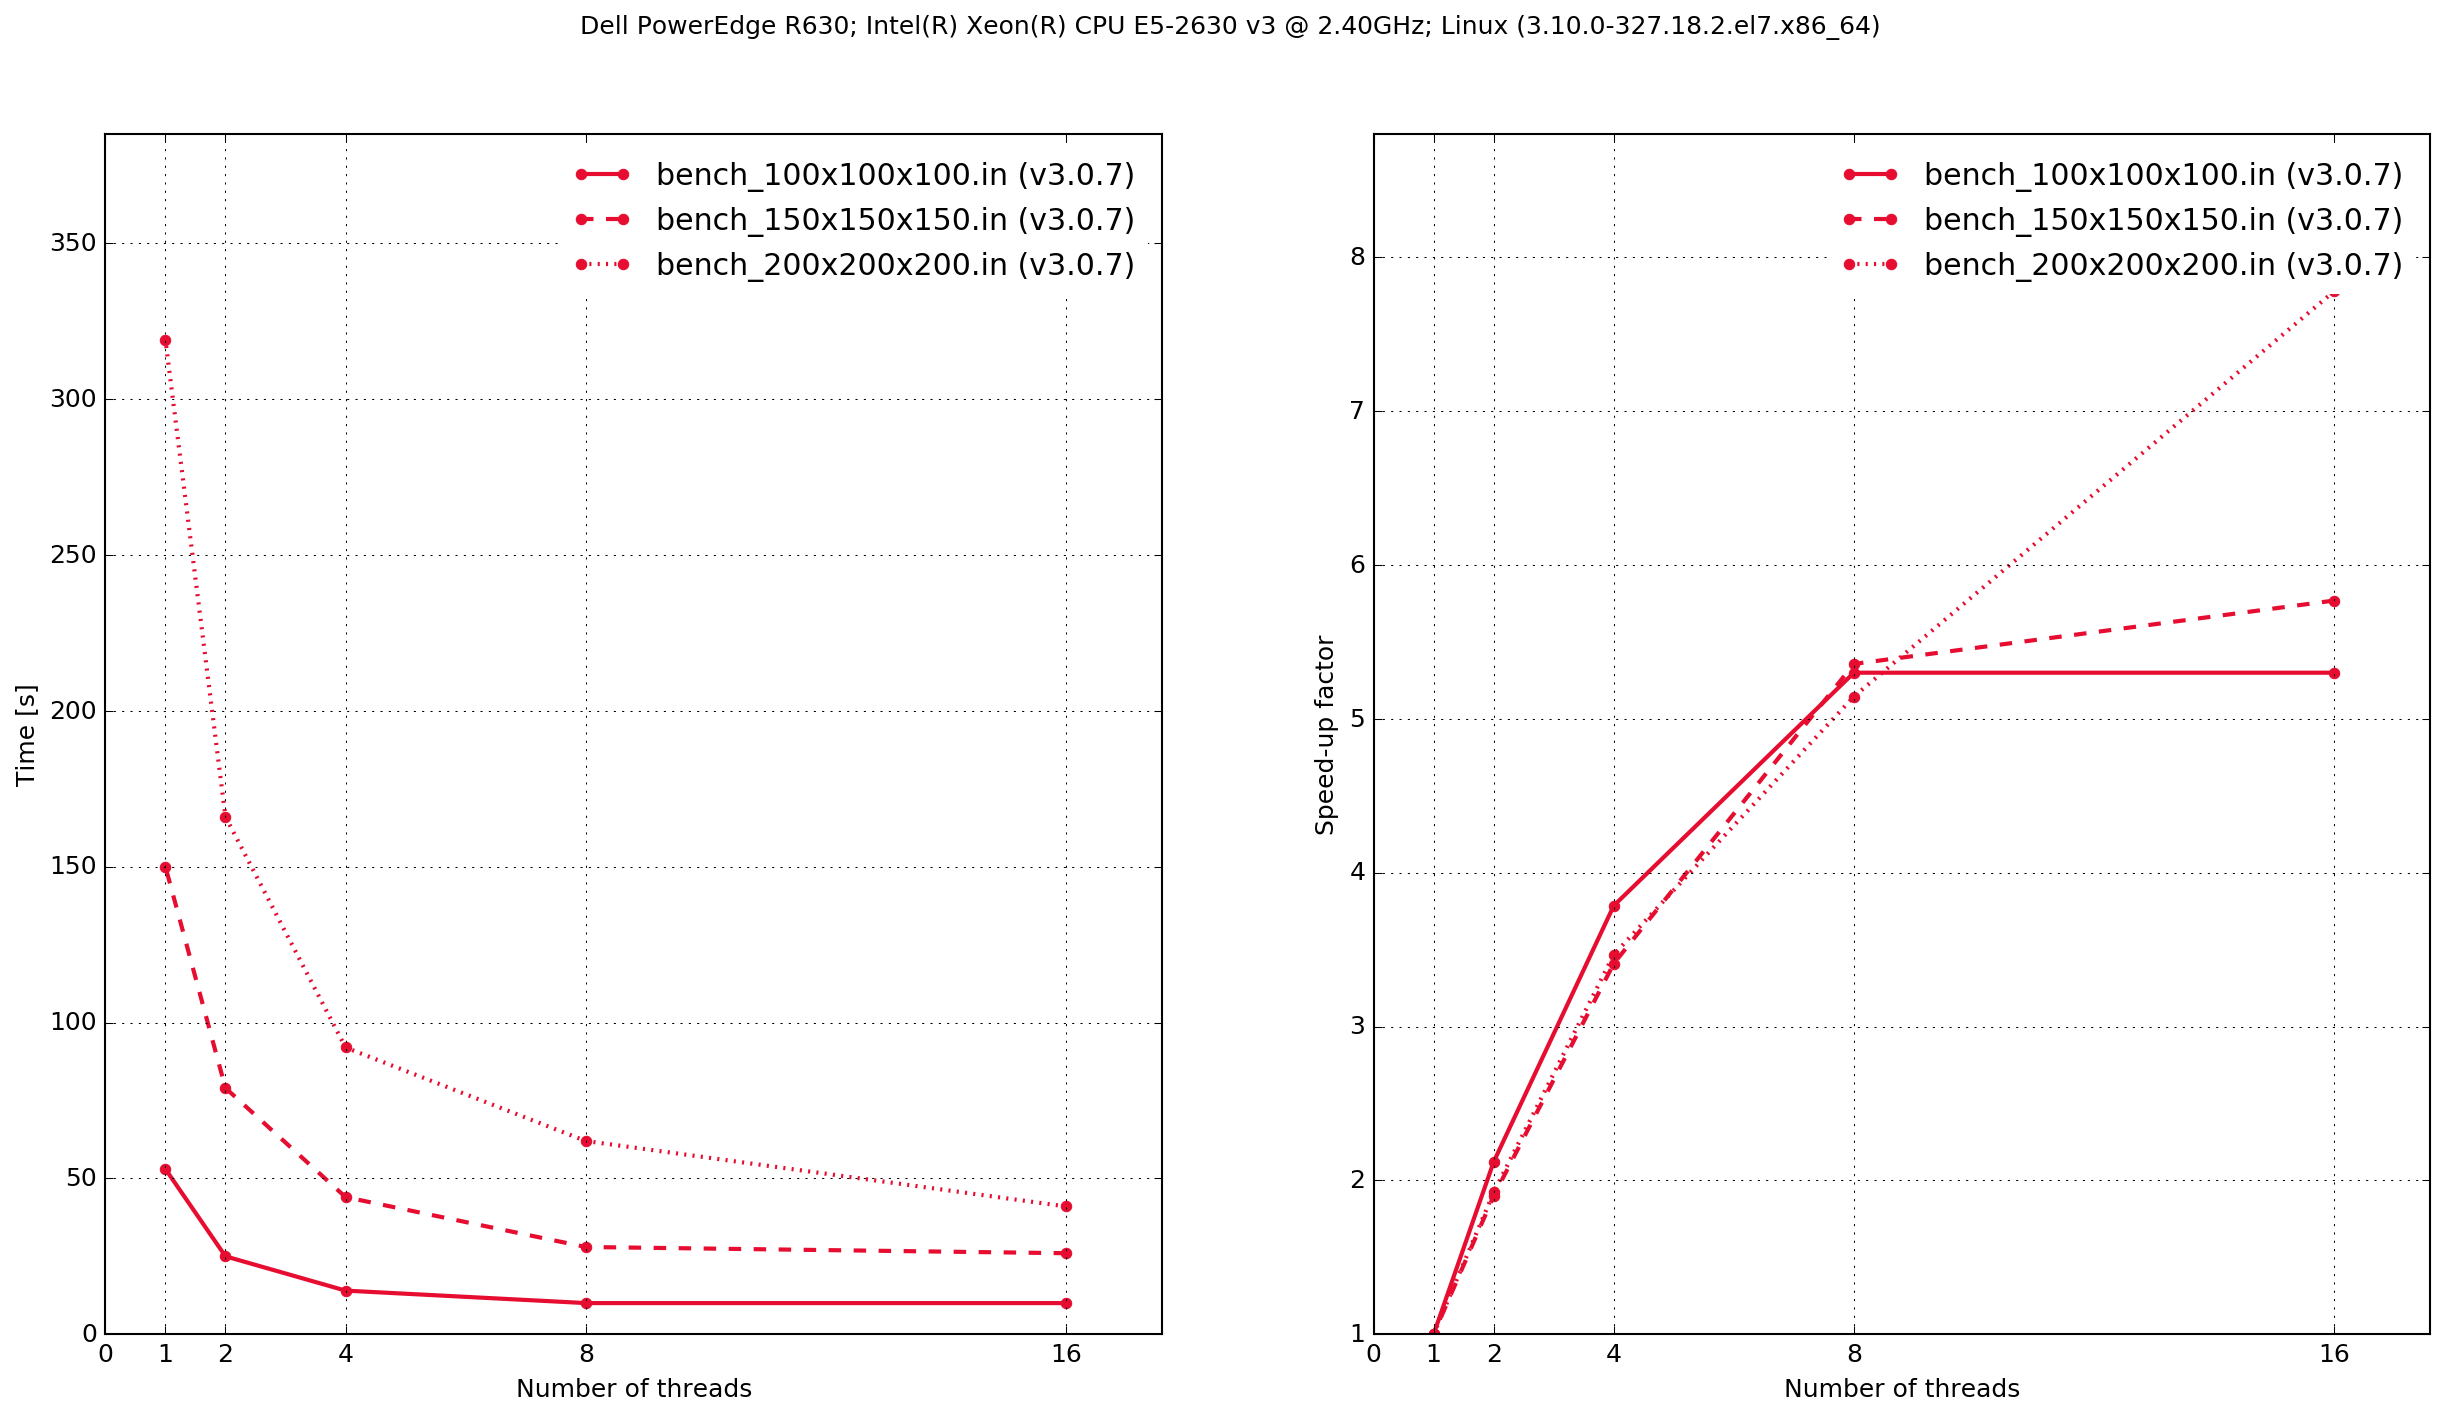
Dell PowerEdge R630
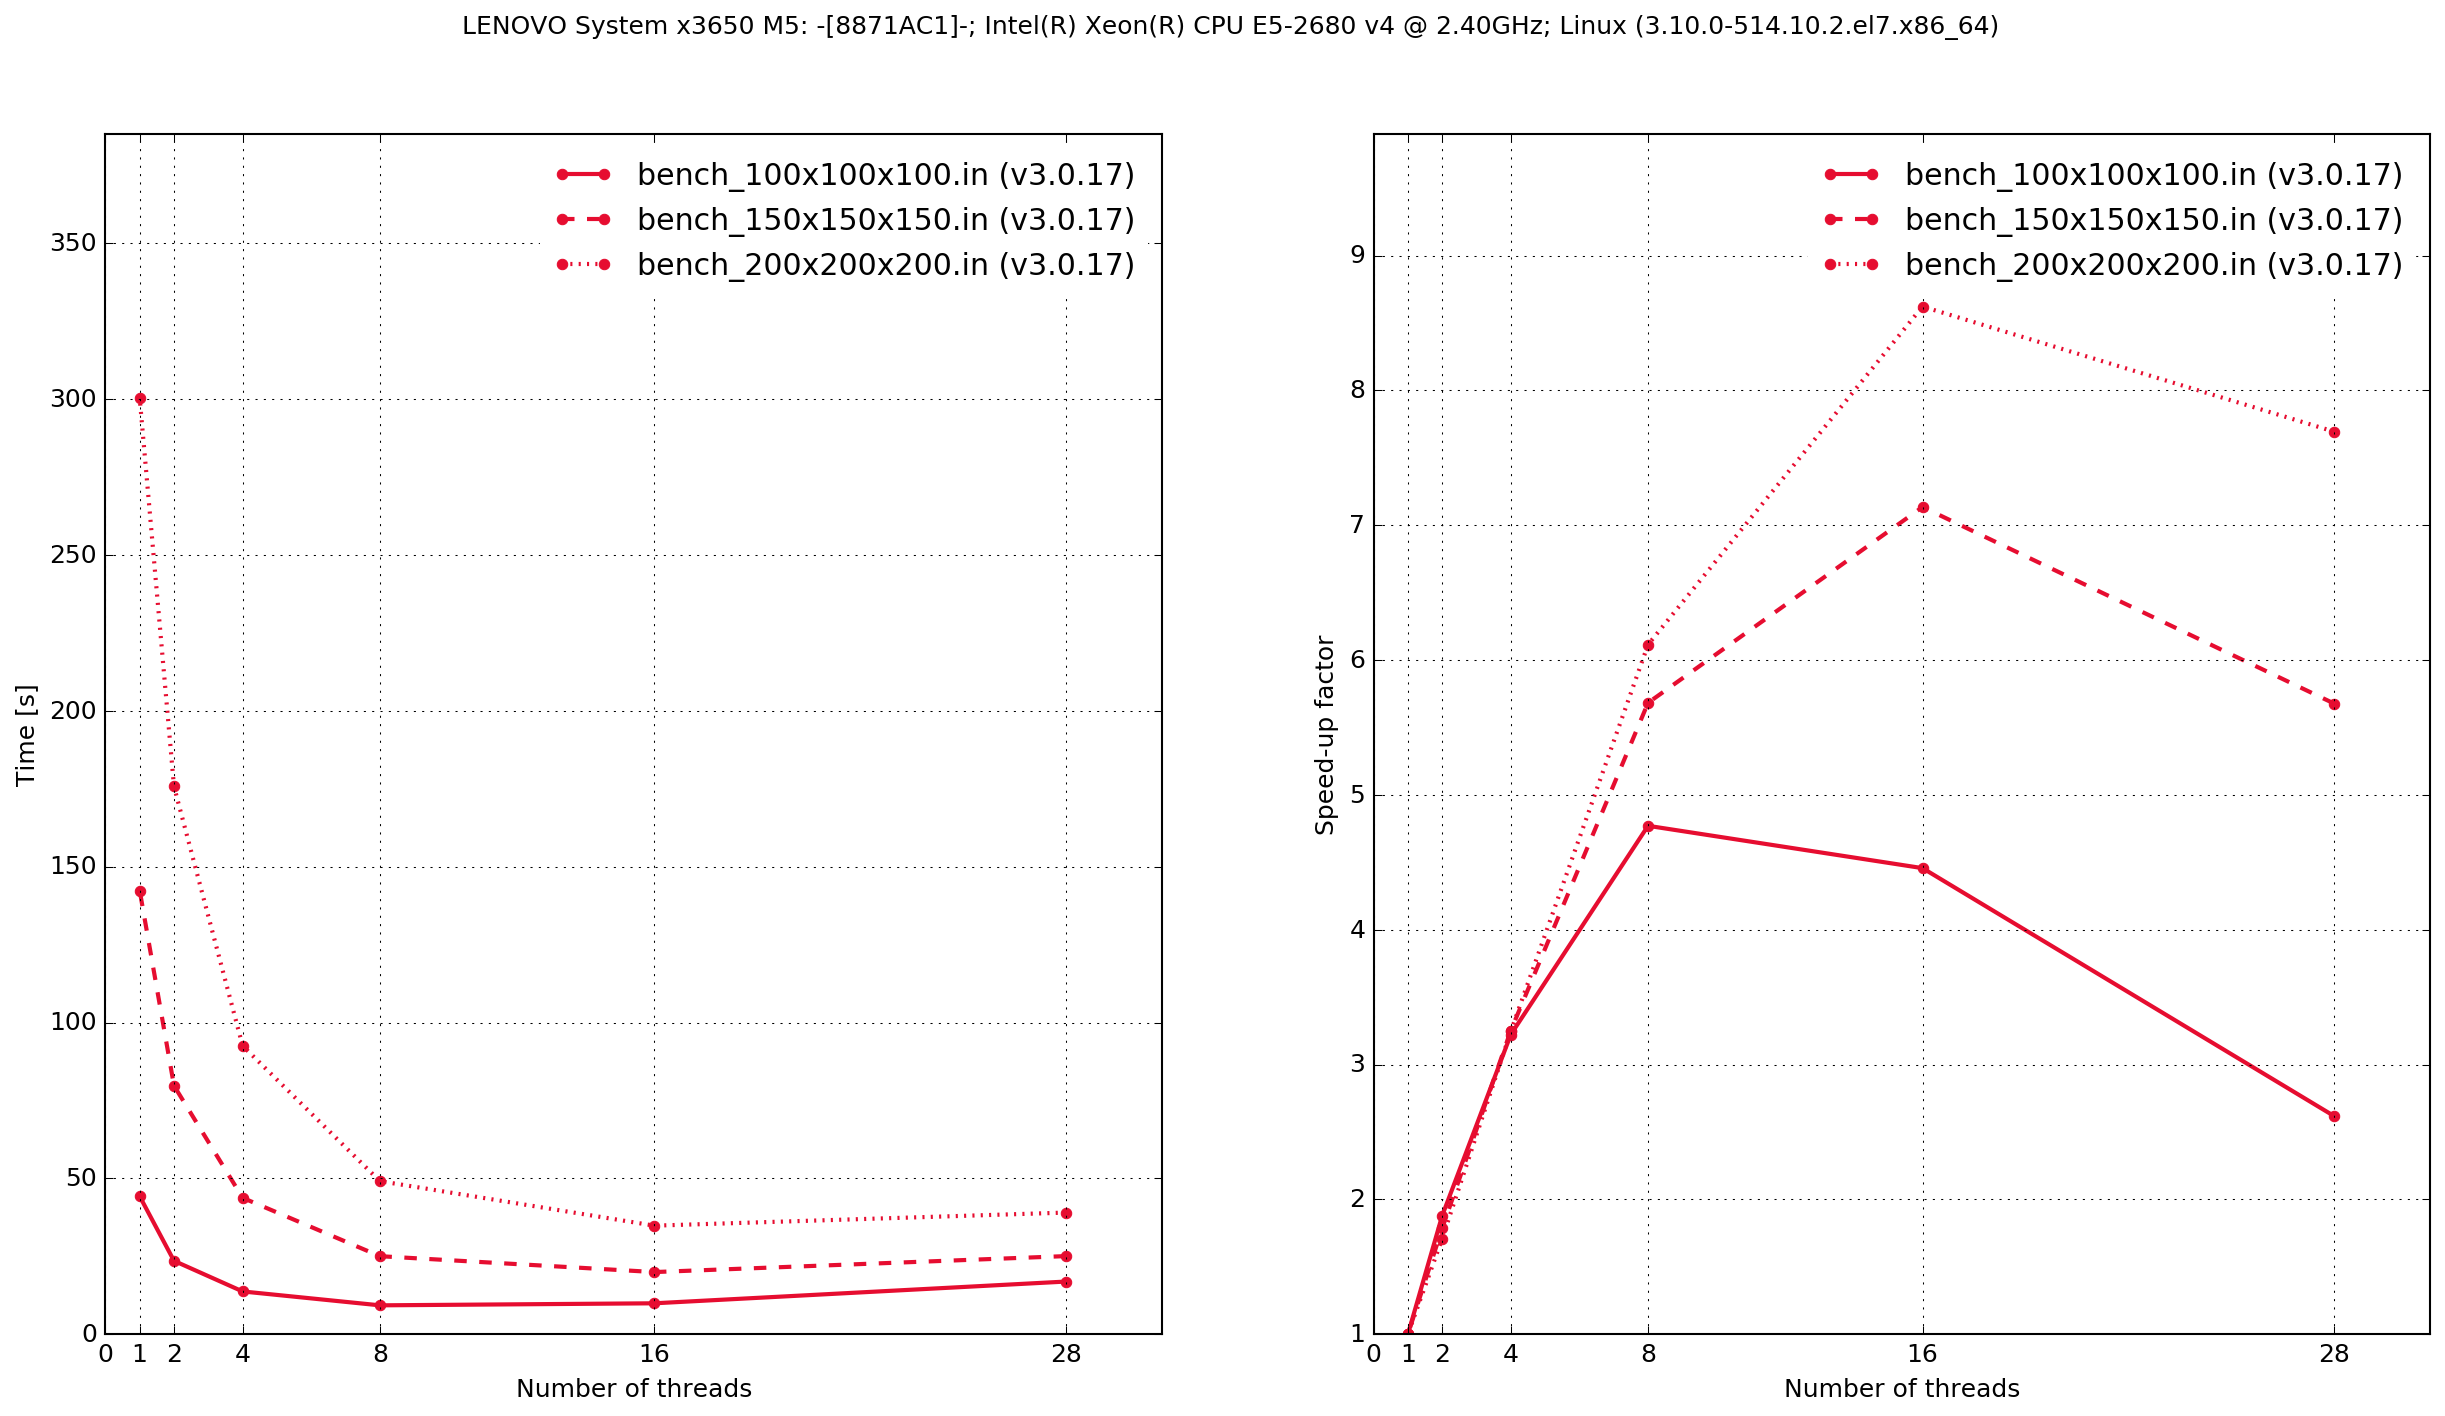
Lenovo System x3650 M5
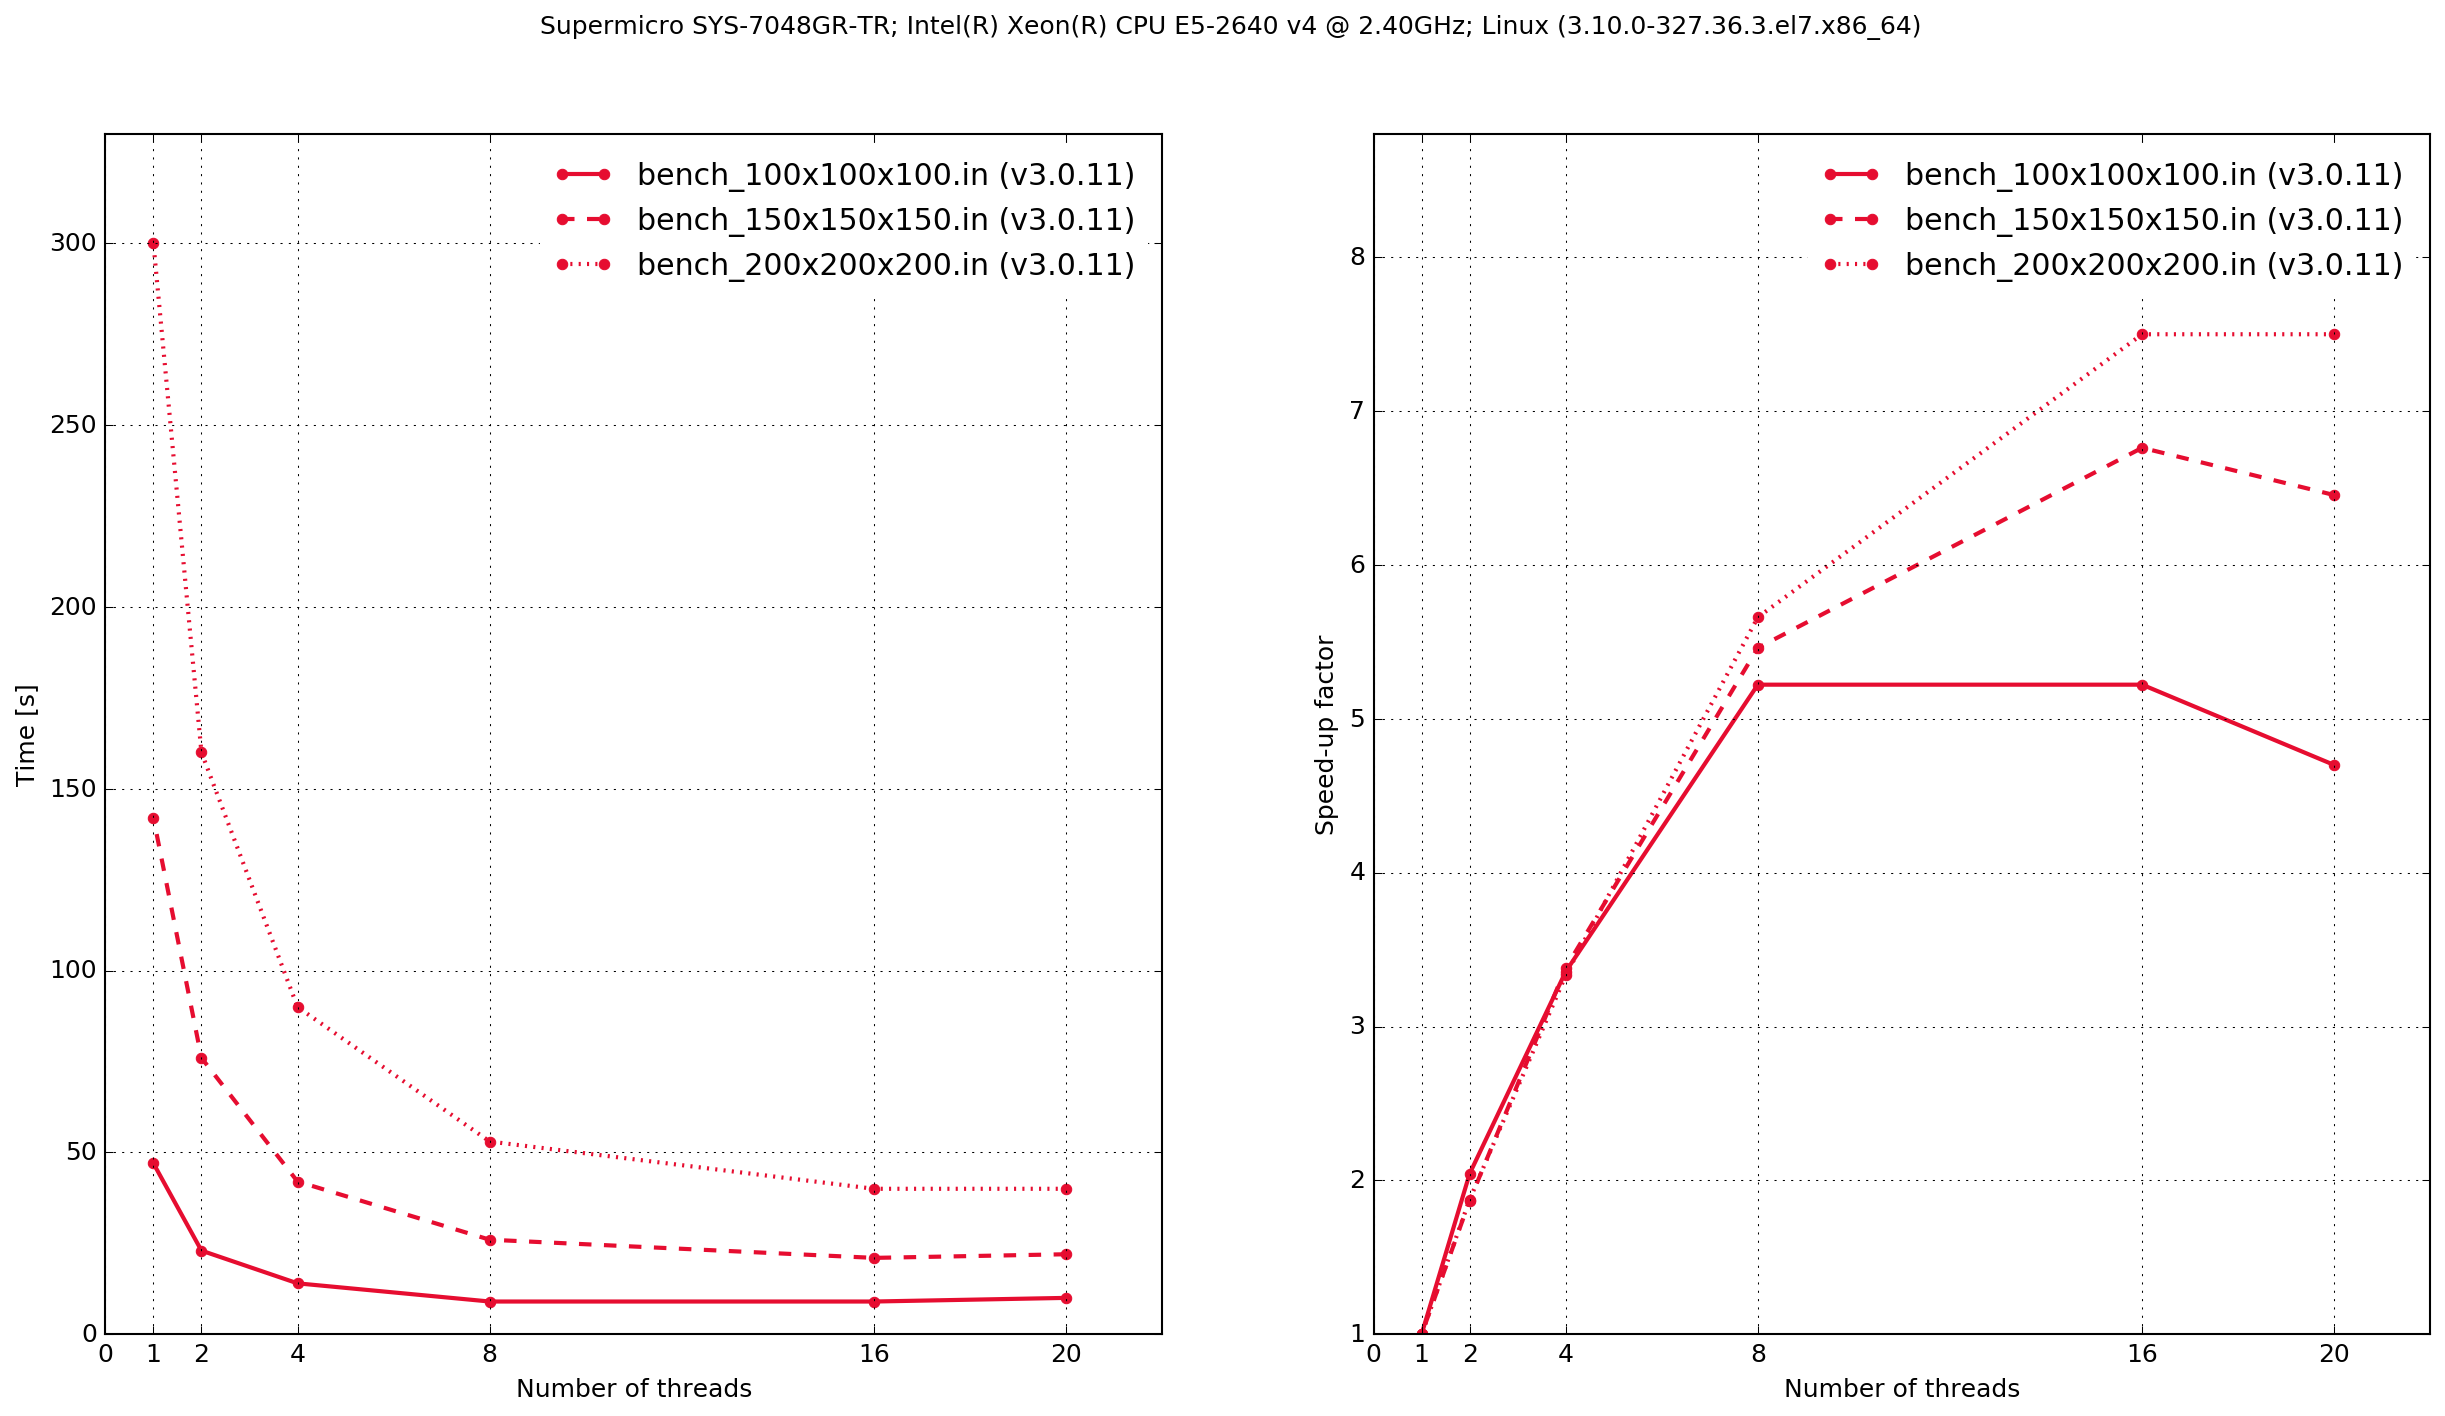
SuperMicro SYS-7048GR-TR
Windows
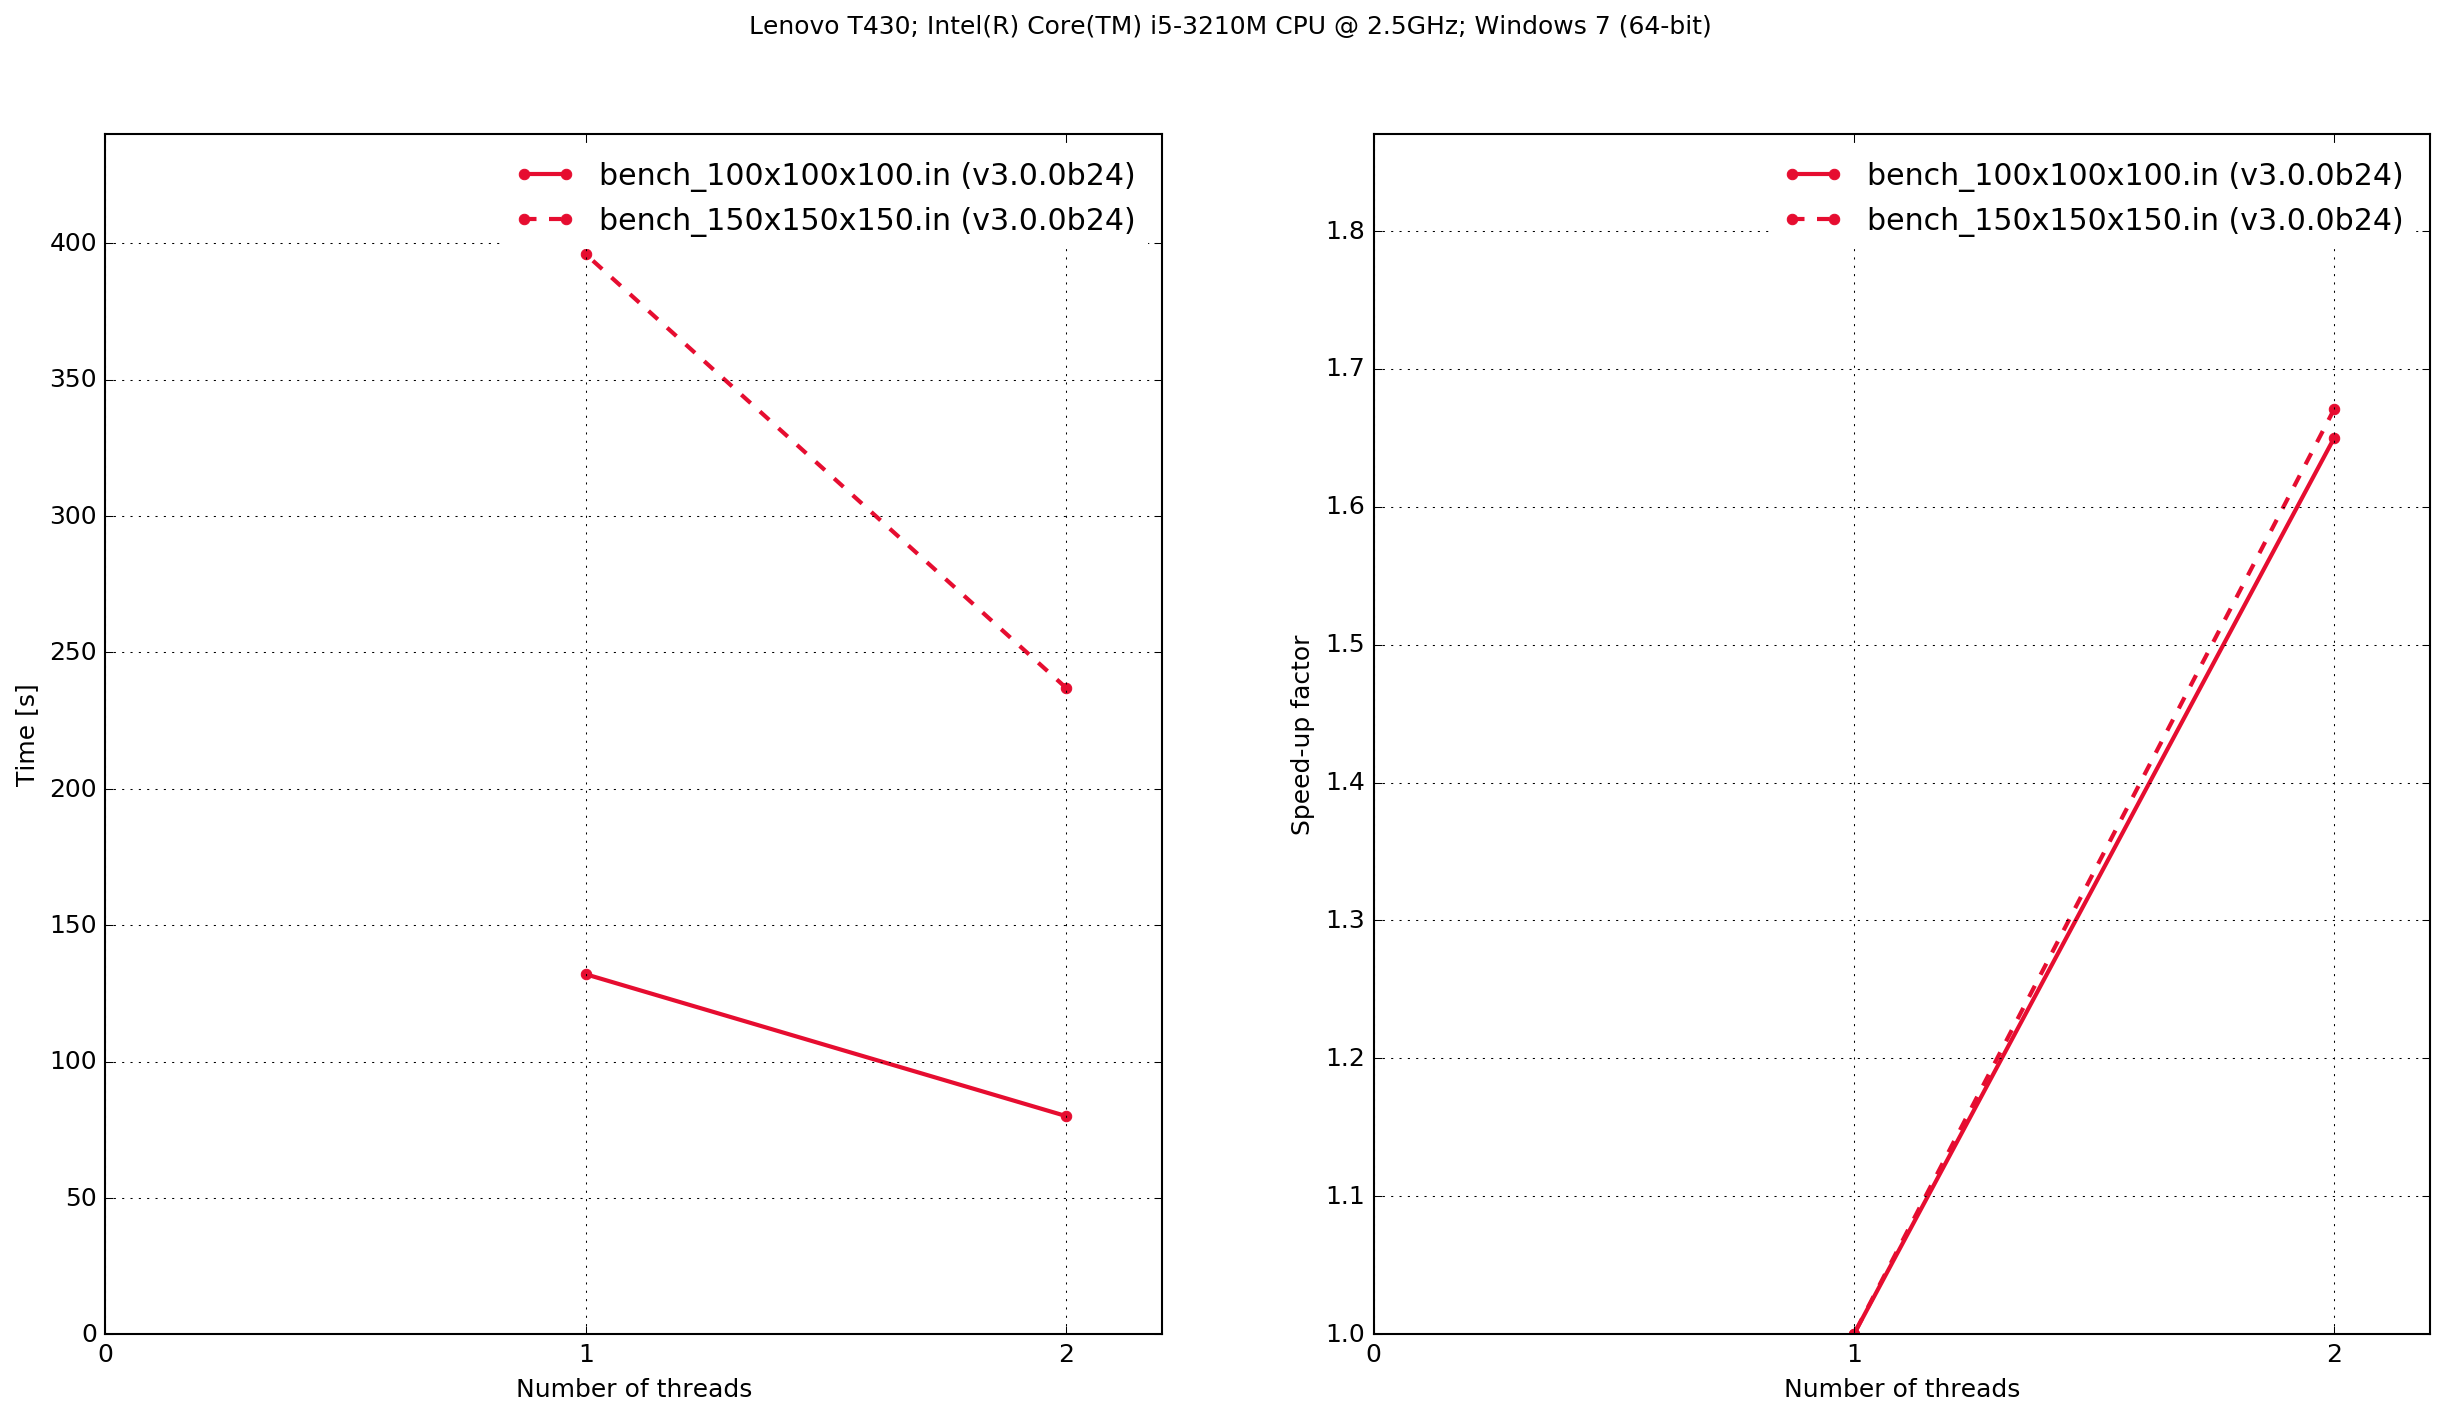
Lenovo T430
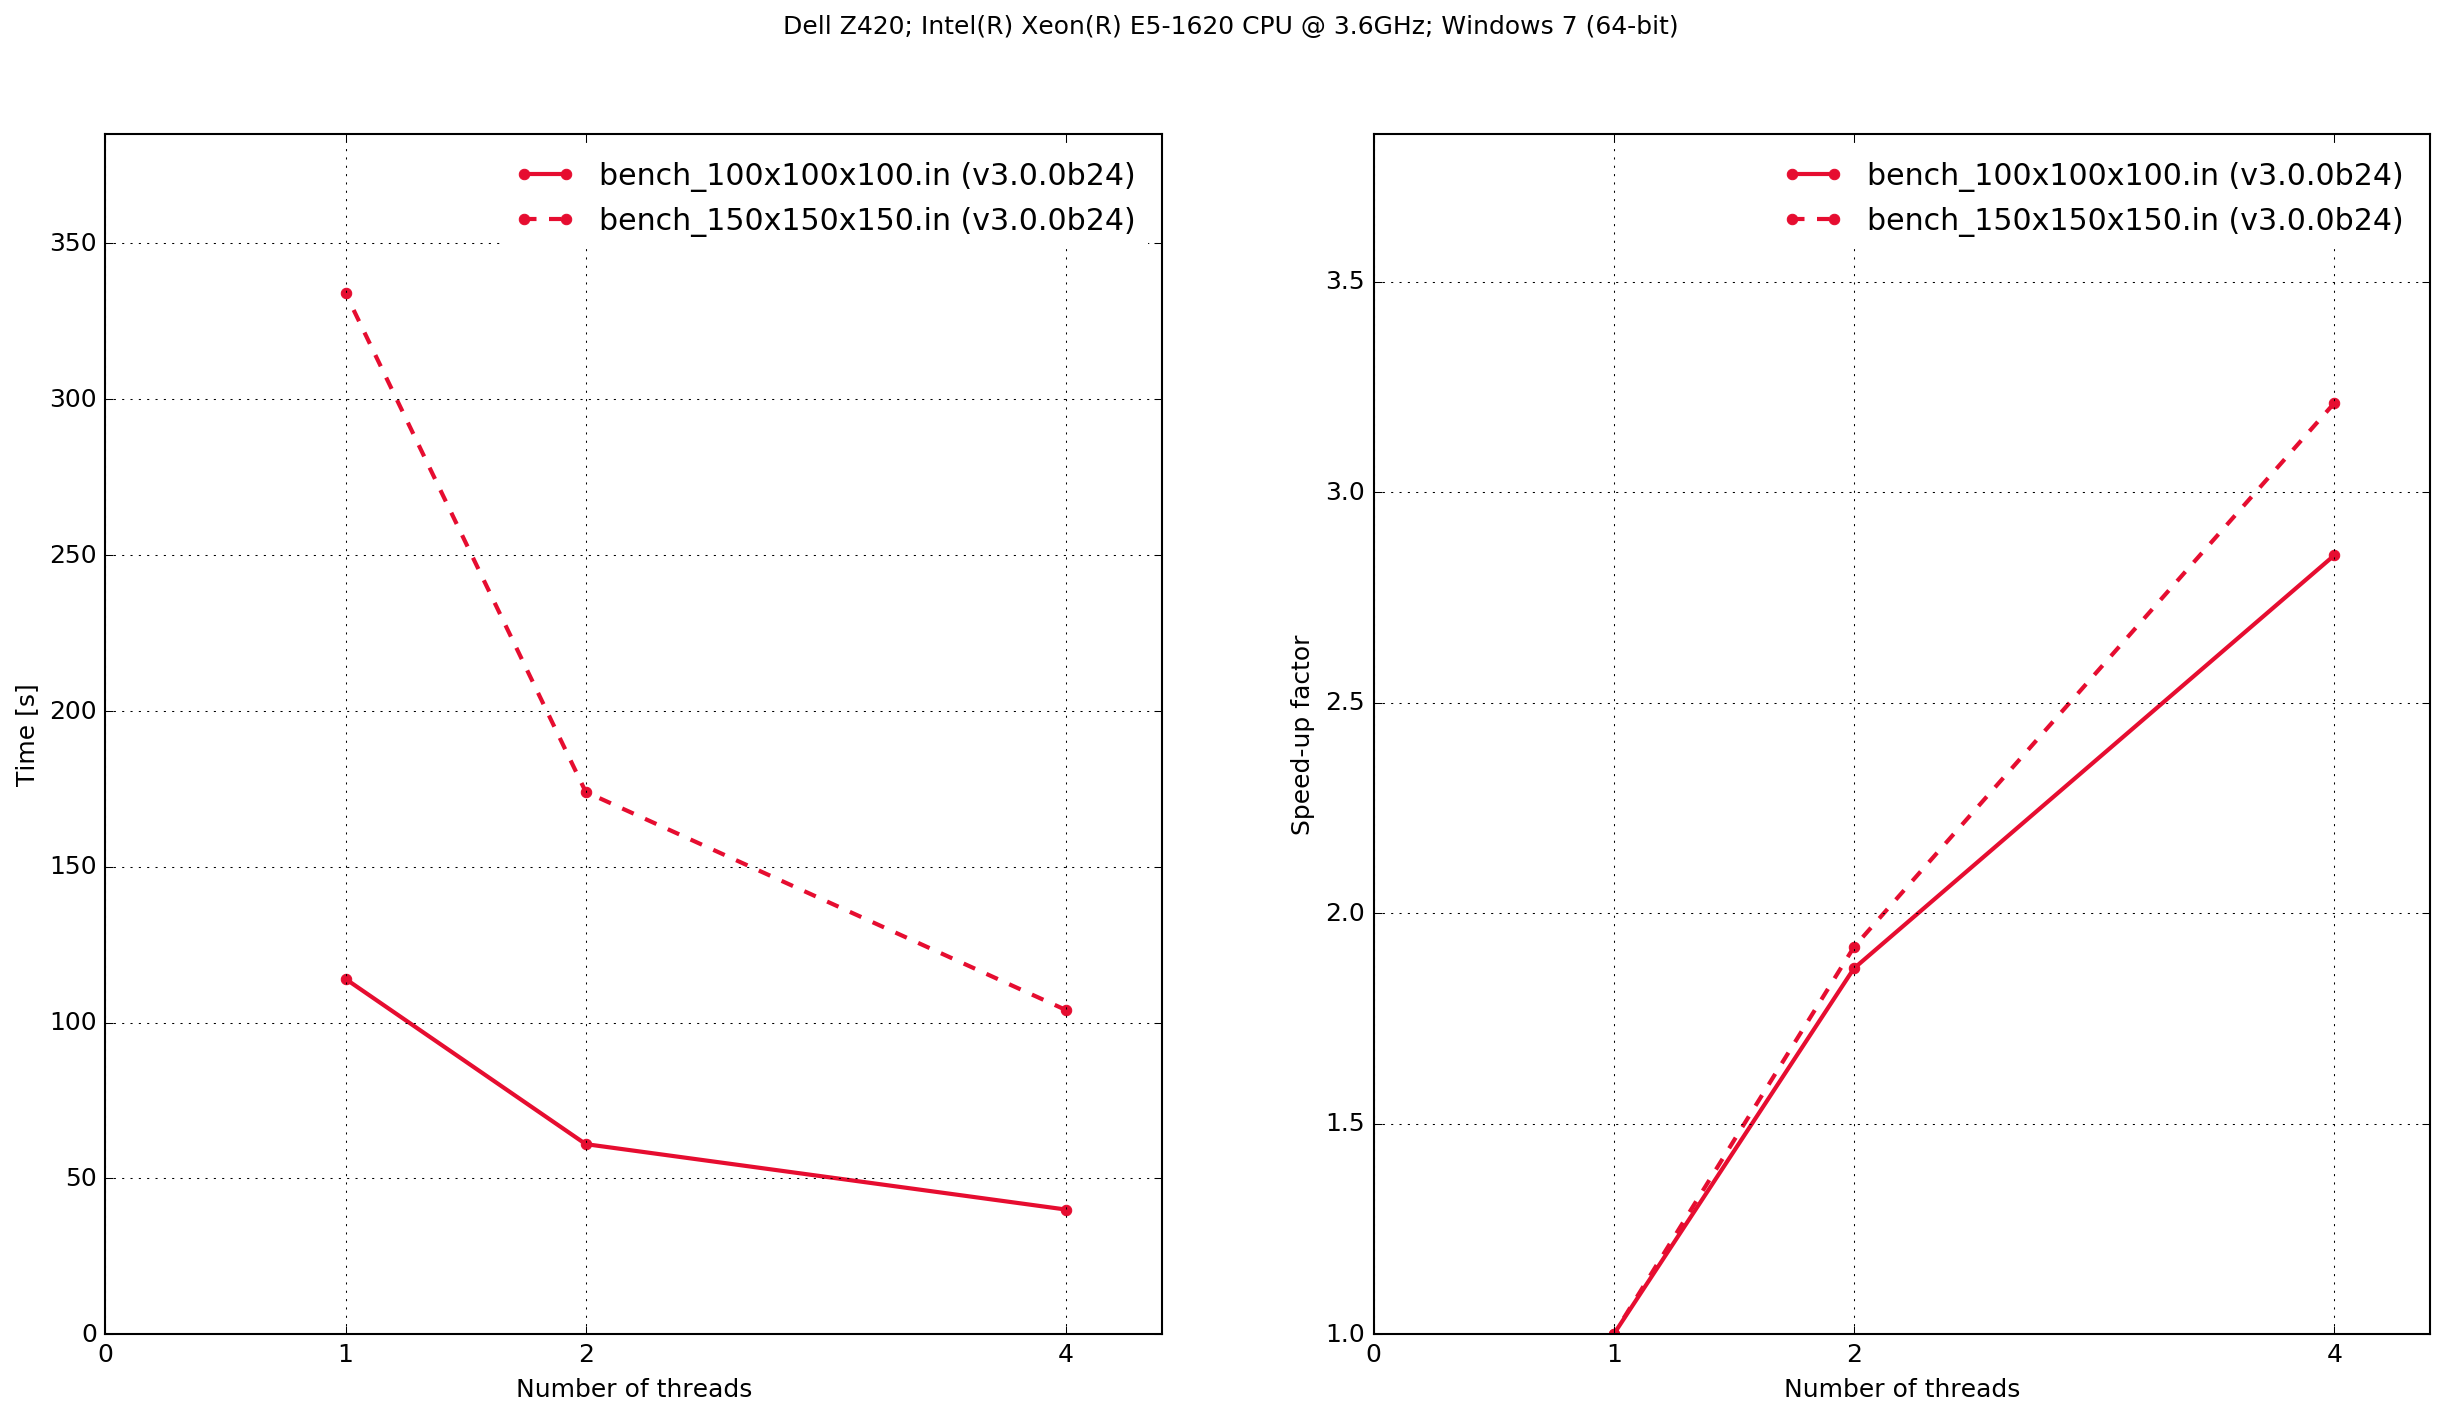
Dell Z420
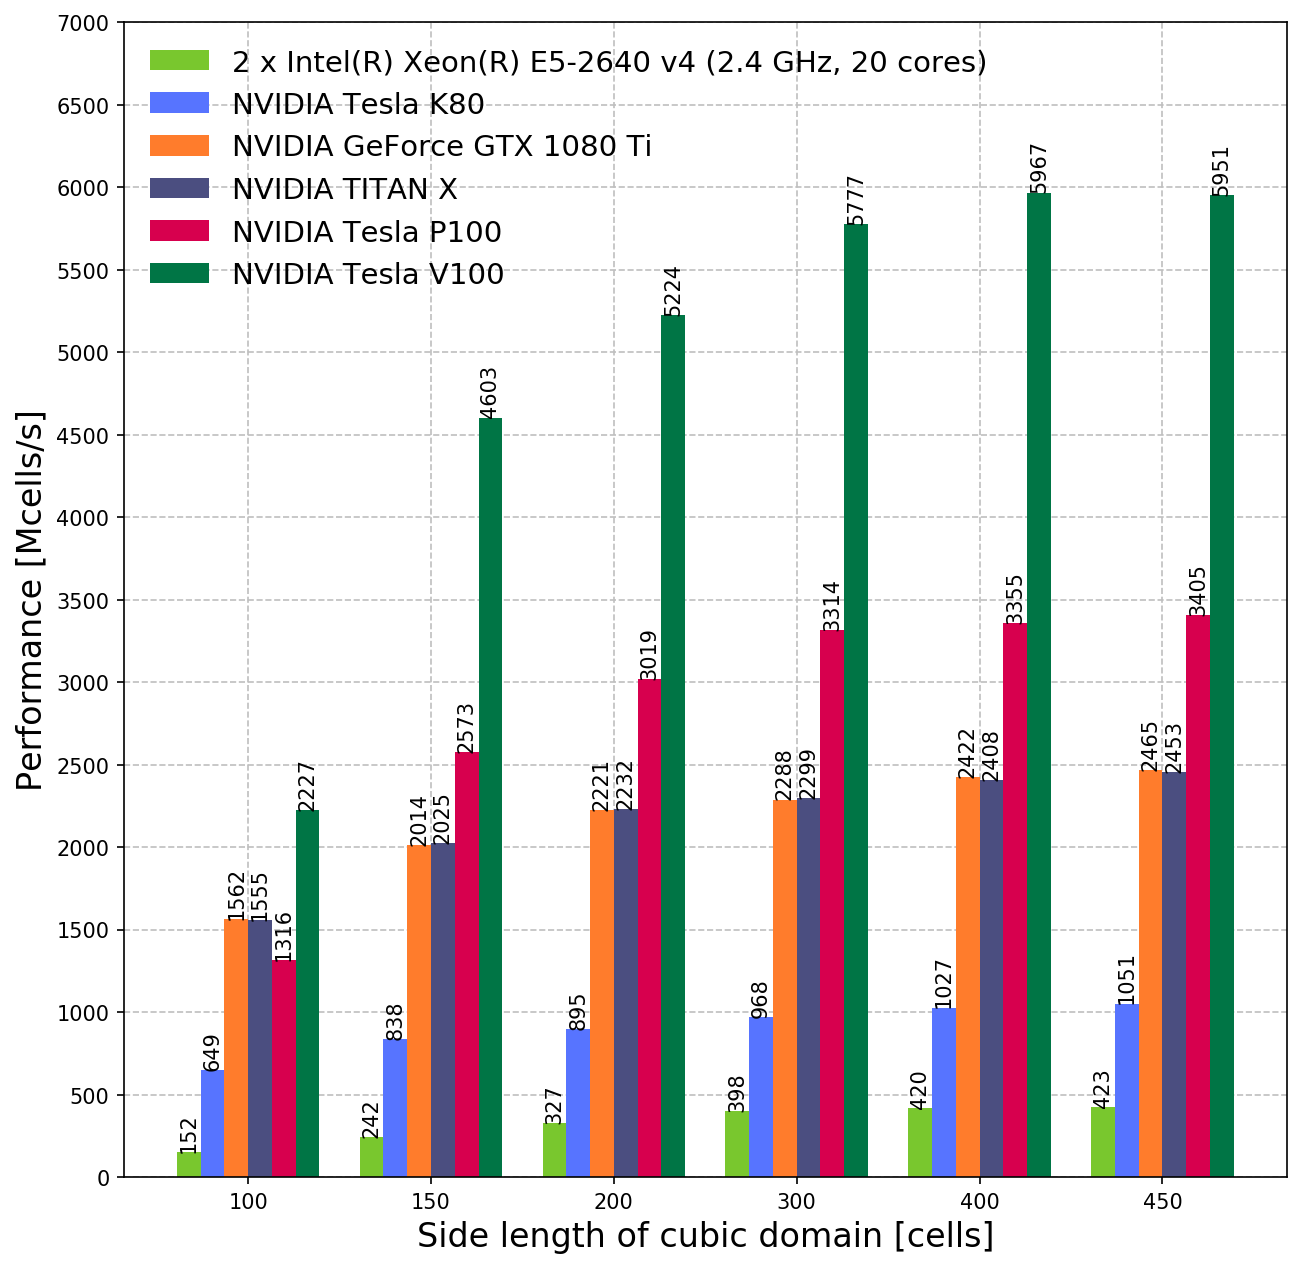
Results: GPU
NVIDIA GPUs
The performance metric used to measure the throughput of the solver is:
where P is the throughput in millions of cells per second; NX, NY, and NZ are the number of cells in domain in the x, y, and z directions; NT is the number of time-steps in the simulation; and T is the runtime of the simulation in seconds.